performance
这是一个用来研究网络加载时间的api
IE9+才支持,http://caniuse.com/#feat=nav-timing
开始之前,建议先随便打开个网页,在console稍微体验一下
- 了解大概有的属性: performance
- 网页加载的时间: performance.timing
- 每个请求所耗费的事件: performance.getEntries()
timing和getEntries有很多一样的属性,但是还是有些不一样的
timing专属属性
- navigationStart: 前一个页面(不一定同域)unload的时间戳,若无前一页,则与fetchStart值相等
- unloadEventStart: 前一个页面(同域)unload回调开始的时间戳,若无前一页,则值为0
- unloadEventEnd: 前一个页面(同域)unload回调结束的时间戳,若无前一页,则值为0
- domLoading: 开始渲染DOM树的时间,此时document.readyState变为loading(抛出readystatechange事件)
- domInteractive: 完成解析DOM树的时间,此时document.readyState变成Interactive(抛出readystatechange事件),(此时还没开始加载网页内的资源)
- domContentLoadedEventStart: DOM解析完成后,网页内资源开始加载的时间
- domContentLoadedEventEnd: DOM解析完毕并且网页内资源加载完毕
- domComplete: dom解析完成,资源也准备就绪的时间,document.readystate变成complete,和监听(window.onload捕抓到的时间)
- loadEventStart: load事件传送给文档,也是load回调函数执行的时间,若无load事件,则为0,
- loadEventEnd: load事件回调函数执行完毕的时间
getEntries返回对象的专属属性
- name: 资源绝对路径
- entrtType: 表名在哪个performance对象中获取的(未成熟),这个属性参考https://developer.mozilla.org/en-US/docs/Web/API/PerformanceEntry/entryType
- initiatorType: 谁发起的请求,link|script|redirect
- duration: 加载时间
资源请求类型
这里以timing举例,说明下整个timing下来可以获得的时间戳
网上被复用了很多次的图
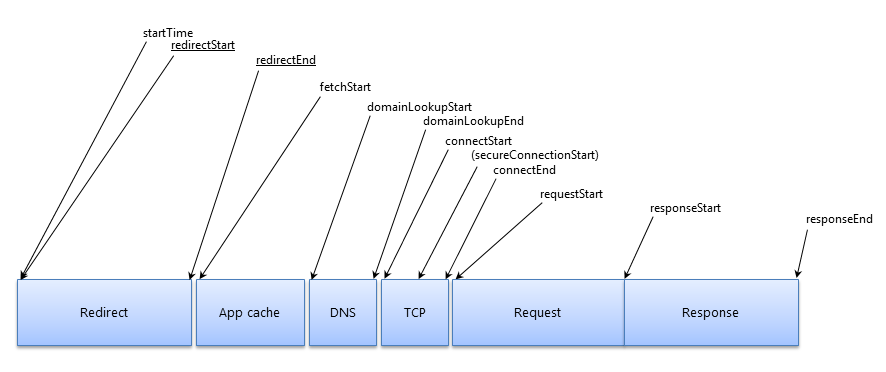
这个图没有举出timing有关DOM的时间,而是把网络相关的时间戳举了出来
这里把dom和网络相关的时间戳都排下序
- navigationStart
- unloadEventStart
- unloadEventEnd
- redirectStart: 第一个重定向发生的时间,有跳转且同域才算,否则为0
- redirectEnd: 最后一个重定向完成的时间,有跳转且同域才算,否则为0
- fetchStart: 浏览器准备好使用HTTP请求抓取文档的时间,发生在检查本地缓存之前
- domainLookupStart: DNS域名开始查询的时间,如果使用了本地缓存(无DNS查询)或持久连接,值与fetchStart一样
- domainLookupEnd: DNS域名查询结束的时间,如果使用了本地缓存(无DNS查询)或持久连接,值与fetchStart一样
- connectStart: TCP开始建立连接时间,若为持久连接,则与fetchStart一样,
- secureConnectionStart: HTTPS开始连接的事件,若不是安全连接,值为0
- connectEnd:TCP连接完成,这里握手结束、安全链接建立完成,SOCKS授权通过,若为持久连接,则与fetchStart一样
- requestStart: HTTP开始读取真实文档的时间
- requestEnd: Http开始接受响应的开始时间
- responseEnd: HTTP接受响应文档完成
- domLoading
- domInteractive
- domContentLoadedEventStart
- domContentLoadedEventEnd
- domComplete
- loadEventStart
- loadEventEnd
更精确的计算程序运行时间
如果要统计两个点之间的时间间距
可以使用下performance.mark和performance.measure
每执行一次mark(唯一标识),
都可以通过performance.getEntriesByType('mark')获取所有的mark点
同理,measure是计算两个mark点之间的消耗时间
performance.getEntriesByType('measure')获取
使用方法: performance.measure(measure唯一标识,mark开始点唯一标识,mark点结束唯一标识)
这种做法和一般两个Date.now(),然后相减得出结果的区别是
- Date.now返回到毫秒,而performance.mark|performance.now()是计算到百万分之一秒的
- Date.now会受系统程序阻塞,而performance.now()是以恒定速率递增,不受系统时间或阻塞影响
- 获得结果,一般相减后的结果要主动的保存,而performance.measure,会保存到performance里
tips
使用的时候需要注意的点
- 资源如果是第三方加载的话,若没加上
Timing-Allow-Origin: *头则只能获取持续时间(但是笔者亲测好像没这个问题) - performance和performance.getEntriesByType的兼容性不是一致的
- 用完了也可以清除一下mark和measures
- 清除指定标记performance.clearMarks(唯一标识)
- 清除所有标记performance.clearMarks()
- 清除指定测量performance.clearMeasures(唯一标识)
- 清除所以测量performance.clearMeasures()
- 当你在获取timin属性时,这个阶段还没完成,值为0
- 当在file://下,performance.getEntries()不会捕抓到任何内容
- performance.getEntries()只能捕抓到类型和url还有加载相关的时间,无法知道是哪个dom的
其余注意
- 当mp4被部分缓存时,performance无法将其列举出来
- 有出现过同一url的mp4(206传输),在performance出现过两次
- mp4文件(206),即使在后续会继续出现206加载时,performance不会变化